How Much JS Should a Reservation Widget Cost? Measuring It for Real
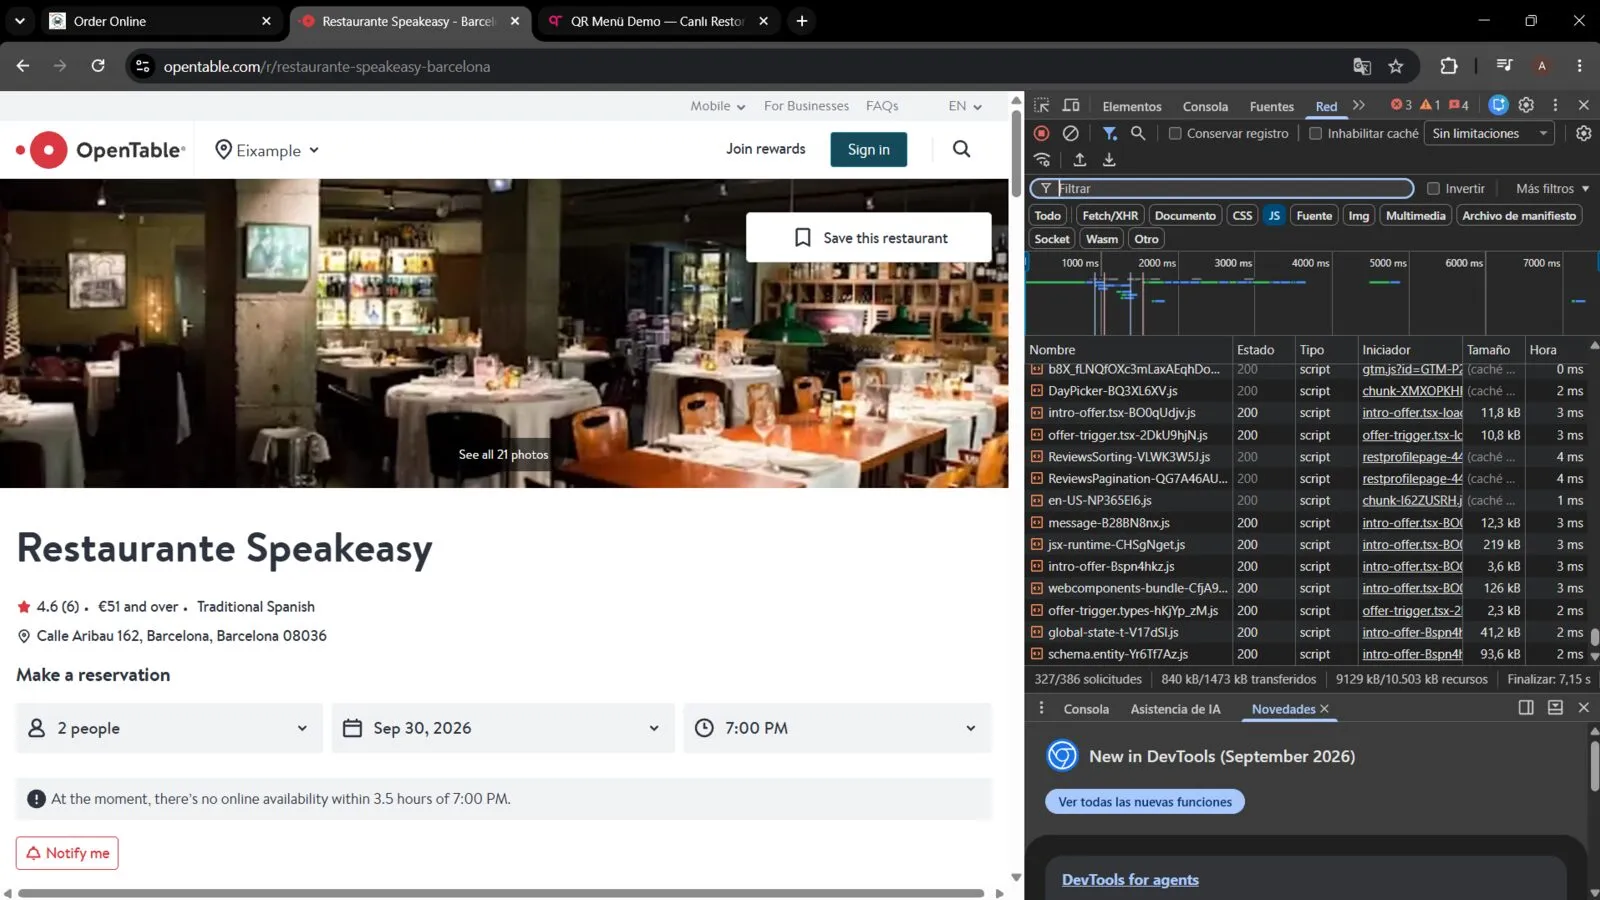
If someone hands you a single figure for “how much JavaScript a reservation widget adds,” without saying which widget, which exact page, and which measurement method, that figure isn’t data — treat it the same as a vendor’s own marketing claim, because it likely came from one.
Two Mistakes That Produce a Wrong Number
Trying to answer this honestly surfaces the same trap twice:
- Measuring the platform’s full website instead of the embeddable widget. A reservation platform’s own consumer-facing homepage carries search, session tracking, reviews, and its entire site bundle — that’s a completely different, much larger thing than the small script a restaurant actually pastes into its own page. A homepage capture showing megabytes of resources measures the platform’s website, not the widget.
- Not confirming the DevTools filter actually applied. The Network panel’s “JS” filter is a clickable type chip above the request list, not a text search box. Typing “js” into the search field instead matches on URL substrings and silently gives you a different, unreliable set of requests — often the full unfiltered page. Always confirm the JS chip is visibly selected (highlighted) before reading the totals.
Live widget demos also sometimes go stale — an embed example built around a specific restaurant ID from an old blog post or code sample can point at a listing that no longer exists, loading nothing at all rather than failing visibly. If a widget demo you’re testing shows a blank result, check that first before assuming your measurement method is at fault.
The Method, Step by Step
- Open an incognito window, to rule out extensions and cached scripts.
- Navigate to the actual widget embed — a live installation on a real page, or the vendor’s dedicated widget demo, never the platform’s own marketing homepage.
- Open DevTools (
F12orCtrl+Shift+I/Cmd+Option+I) → Network tab. - Click the JS type chip above the request list to filter to scripts only.
- Reload the page (
Ctrl+R/Cmd+R). - Read the “transferred” number in the bottom summary bar — the gzip-compressed size that actually determines load time — not “resources,” which is the larger, uncompressed figure.
Why This Is Worth Doing Before You Pick a Platform
A widget’s JavaScript weight interacts directly with two things covered elsewhere in this cluster: whether it slows down the page enough to hurt your Core Web Vitals, and whether your Content-Security-Policy needs updating to allow it to load at all. Measuring your actual shortlist — not relying on a published average that doesn’t exist for this specific claim — is also the same discipline that matters when comparing OpenTable against embedding your own widget: verify the real, current numbers yourself rather than trusting an aggregated claim, because both pricing and script weight change and neither vendor is obligated to publish either one.